Conditional Formatting, Excel
Jul 30, 2026
The Pivot Table and Percentage of Total Calculations
Key Takeaways
- PivotTables can display values as a percentage of grand total, subtotal or a custom base item using the "Show Values As" feature.
- The "% of Grand Total" option shows each value's contribution to the overall total, while "% of Parent Row Total" shows contribution within a subgroup like a region or department.
- You can create custom percentage comparisons by selecting a specific base field and base item in the Value Field Settings dialog.
- These percentage options eliminate the need for manual formulas or calculated items, saving significant time when building reports.
Why Use Percentage of Total in a PivotTable
Once you learn how to create an Excel PivotTable, you'll discover that organizing your information is only the first step in getting the most out of this useful feature. PivotTables then give you the ability to further manipulate the organized information. Value Field Settings let you perform different types of summarizations. Calculated Fields and Calculated Items let you build formulas based on PivotTable values. And, when you want a PivotTable to help you see relationships within your data, you can show values in terms of percentage of totals and even percentage of subtotals.
The ability to show percentage of total in a PivotTable is one of the most practical ways to turn raw numbers into meaningful insights. Instead of scanning rows of figures, you can instantly see proportional contributions across your data. Common use cases include:
- Identifying which regions, products or team members contribute the most to overall revenue
- Comparing segments within a category to understand relative performance
- Presenting proportional data to leadership without building separate charts or formulas
- Simplifying Excel reporting by letting the PivotTable handle percentage calculations automatically
Excel pivot table percentage calculations rely on the "Show Values As" options found inside Value Field Settings. These options let you switch between several percentage views without writing a single formula.
Before You Begin
Before you start, make sure you have the following in place:
- Excel version: Excel 2010 or later, including Excel 2013, Excel 2016, Excel 2019, Excel 2021 and Excel for Microsoft 365
- Dataset format: Your source data should be organized in a tabular layout with column headers and no blank rows
- Basic PivotTable knowledge: You should be comfortable creating a basic PivotTable from a data range
- Sample file: Download Excel pivot table percentage of total.xlsx to follow along with the examples below
How to Show Percentage of Total in a PivotTable
In our example, we have a PivotTable that organizes and summarizes sales data by region and sales person. We would like to see which regions are performing the best, and which salespeople in each region are contributing most to their area. Percentage of Total is a good way to show relationships to a whole.
To show percentage of total in an Excel PivotTable, create your PivotTable with the information you want summarized. Then click anywhere in your PivotTable and open the PivotTable Fields pane. In the Values area, select Value Field Settings from the field's dropdown menu.

In the Value Field Settings dialog box, select the Show Values As tab. The default is "No Calculation". But by opening the Show values as dropdown menu, you can see a variety of options for how your totals are displayed.
PivotTable Percentage of Grand Total
Once you select "% of Grand Total" from the "Show Values As" dropdown in the Value Field Settings dialog box and press OK, your PivotTable values are shown as percentages.
- All Sums are shown in relationship to the Grand Total
- Individual sales person sums are shown as percentage of Grand Total
- Regional totals are shown as percentage of Grand Total and reflect sum of Individual sales people in the region

PivotTable Percentages of Subtotals
If we want to see percentages of subtotals – such as how well each sales person contributes to their region instead of the Grand Total, we'll select "% of Parent Row Total" from the same "Show Values As" dropdown.
- Regional sums are shown as percentage of Grand Total
- Individual salesperson sums are shown as percentage of Region
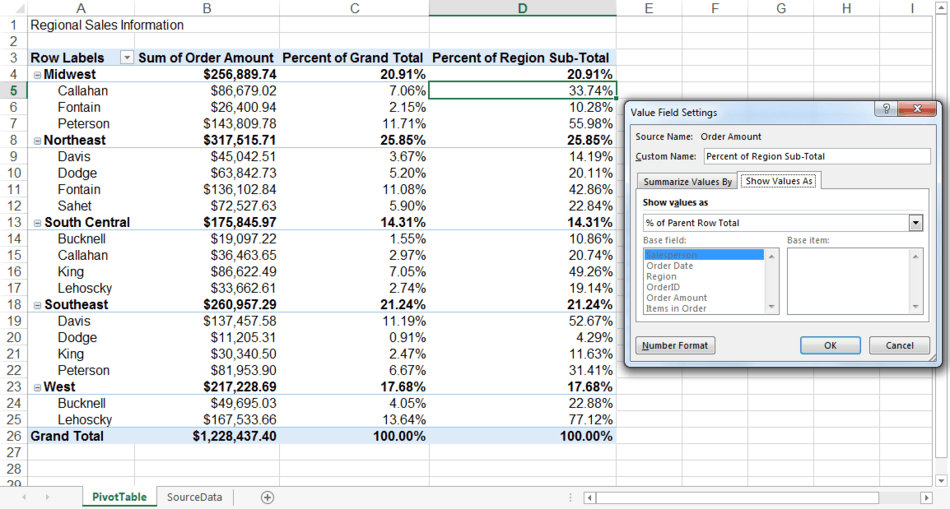
With this analysis, you can quickly see that the Northeast region is the top performer, as it contributes the biggest percentage to the bottom line. We can also see that Lehoscky is the top sales person overall and in the West region, but comes in only third in the South Central region.
Custom PivotTable Percentage
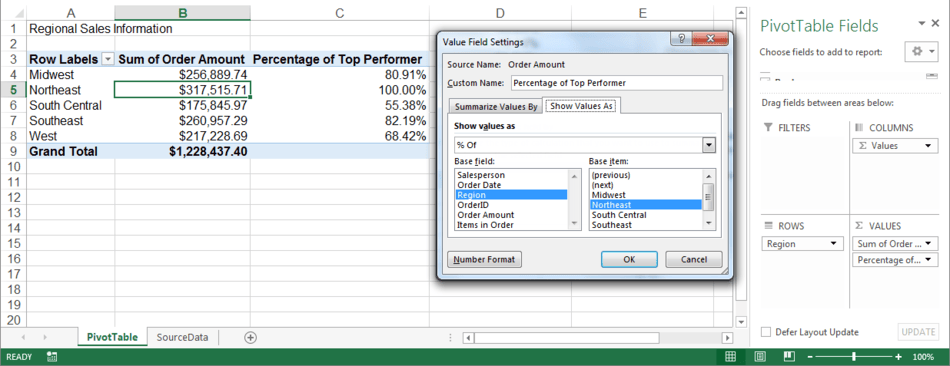
Finally, PivotTables let you create your own methods of comparison. When you select "% of" from the "Show Values As" dropdown, two additional fields appear: Base field and Base item. By setting the Top Performing Northeast region as our Base item and using the "% of" option, we can see how well the other regions are doing as a percentage of the Northeast's performance.
PivotTable Percentage Options at a Glance
The "Show Values As" dropdown includes several percentage-related options beyond the three covered above. The following table summarizes every percentage option available in Excel PivotTables.
| Option Name | What It Calculates | When to Use It |
|---|---|---|
| % of Grand Total | Each value as a proportion of the PivotTable's overall total | Comparing every item's contribution to the whole dataset |
| % of Column Total | Each value as a proportion of its column's total | Analyzing distribution within each column category |
| % of Row Total | Each value as a proportion of its row's total | Analyzing distribution across row categories |
| % of Parent Row Total | Each value as a proportion of its parent row category's subtotal | Seeing how items contribute within a grouped row |
| % of Parent Column Total | Each value as a proportion of its parent column category's subtotal | Seeing how items contribute within a grouped column |
| % of Parent Total | Each value as a proportion of the parent total for the selected base field | Comparing contributions at any level of a hierarchy |
| % Of (custom base) | Each value as a proportion of a specific base field and base item you choose | Benchmarking all items against a single reference point |
Strengthen Your Excel Skills with Pryor Learning
The "Show Values As" percentage features can save you a lot of time by letting you skip having to create complicated formulas or PivotTable calculated items by hand. Whether you need to present regional performance breakdowns or benchmark one product line against another, these built-in options make proportional analysis fast and straightforward.
Pryor Learning offers live and On-Demand Excel training for all skill levels, from PivotTable fundamentals to advanced data analysis. If you want to deepen your pivot table percentage of total skills and explore everything Excel has to offer, check out our Advanced Excel training.